Loading... # 引言 某次刷路由器和信号监测时候的一个产物,显示网卡IP信息,ping公网IP延迟图表。 起因是周末的时候无线网不稳定,想着刷一下路由器固件,这个路由器是当时上大学时候淘来的斐讯K2,可玩性确实挺强的,但是没有USB接口。emmm 话说回来,我的网络结构是连接客厅的WIFI,相当于中继器,并且自己组网,刷路由器因为不同固件他们的后台IP都不一样,有的是`192.168.1.1`,有的是`192.168.199.1`,这玩意儿在路由器还没有完全启动的时候是看不出来的,只能`ipconfig`刷,这么刷也挺累的(要是有watch命令就好了)。 接下来就是调整路由器位置,那块儿信号好,毕竟是中继,路由器固件也不太一样,信号强度不太好获取,那就另辟蹊径用ping来间接显示网络状况。所以就出了这个东西。 # py代码 ```python import tkinter as tk from tkinter import ttk import psutil import threading import time from ping3 import ping import matplotlib.pyplot as plt from matplotlib.backends.backend_tkagg import FigureCanvasTkAgg import matplotlib.font_manager as fm # 目标网站 targets = { "百度": "www.baidu.com", "哔哩哔哩": "www.bilibili.com", "京东": "www.jd.com", "抖音": "www.douyin.com" } # 存储每个网站的 Ping 延迟历史记录 ping_history = {site: [] for site in targets} # 获取所有网卡的 IP 地址 def get_network_info(): info_list = [] for interface, addrs in psutil.net_if_addrs().items(): for addr in addrs: if addr.family == 2: # IPv4 info_list.append((interface, addr.address)) return info_list # 更新网卡 IP 信息 def update_network_info(): while True: network_info = get_network_info() tree_network.delete(*tree_network.get_children()) for item in network_info: tree_network.insert("", tk.END, values=item) time.sleep(1) # 每 1 秒刷新一次 # 进行 ping 测试并更新 GUI def ping_sites(): timeout=1 while True: for site, host in targets.items(): delay = ping(host, timeout=timeout) result = f"{delay * 1000:.2f} ms" if delay else "超时" tree_ping.item(site, values=(site, host, result)) if delay is not None: ping_history[site].append(delay * 1000) else: ping_history[site].append(timeout * 1000) # 只保留最近 20 个数据点 ping_history[site] = ping_history[site][-20:] update_ping_chart() time.sleep(1) # 每 1 秒刷新一次 # 设置支持中文的字体 font_path = fm.findfont(fm.FontProperties(family='SimHei')) plt.rcParams['font.family'] = fm.FontProperties(fname=font_path).get_name() # 更新 Ping 图表 def update_ping_chart(): ax.clear() for site, history in ping_history.items(): valid_data = [d for d in history if d is not None] if valid_data: ax.plot(valid_data, label=site) ax.legend() ax.set_xlabel('时间') ax.set_ylabel('Ping 延迟 (ms)') ax.set_title('网站 Ping 延迟历史记录') canvas.draw() # 创建 GUI root = tk.Tk() root.title("网络状态监测") root.geometry("400x700") # 创建网卡信息区域 frame_network = ttk.LabelFrame(root, text="网卡信息", padding=10) frame_network.pack(fill="both", padx=10, pady=5, expand=True) tree_network = ttk.Treeview(frame_network, columns=("网卡", "IP 地址"), show="headings") tree_network.heading("网卡", text="网卡名称") tree_network.heading("IP 地址", text="IP 地址") tree_network.pack(fill="both", expand=True) # 创建 Ping 测试区域 frame_ping = ttk.LabelFrame(root, text="网站 Ping 测试", padding=10) frame_ping.pack(fill="both", padx=10, pady=5, expand=True) # 设置 Treeview 的 height 参数为 4,以适配 4 个网站的显示 tree_ping = ttk.Treeview(frame_ping, columns=("网站", "域名", "Ping 结果"), show="headings", height=4) tree_ping.heading("网站", text="网站") tree_ping.heading("域名", text="域名") tree_ping.heading("Ping 结果", text="Ping 结果") tree_ping.pack(fill="both", expand=True) # 插入初始数据 for site, host in targets.items(): tree_ping.insert("", "end", iid=site, values=(site, host, "测试中...")) # 创建 Ping 图表区域 frame_chart = ttk.LabelFrame(root, text="Ping 图表", padding=10) frame_chart.pack(fill="both", padx=10, pady=5, expand=True) fig, ax = plt.subplots(figsize=(6, 4)) canvas = FigureCanvasTkAgg(fig, master=frame_chart) canvas.get_tk_widget().pack(fill="both", expand=True) # 启动线程更新数据 threading.Thread(target=update_network_info, daemon=True).start() threading.Thread(target=ping_sites, daemon=True).start() # 自动调整列宽 def auto_resize_columns(tree): for col in tree["columns"]: max_width = max([len(str(tree.set(item, col))) for item in tree.get_children()] + [len(col)]) * 10 tree.column(col, width=max_width, stretch=True) # 在 GUI 更新后调用 root.after(1000, lambda: auto_resize_columns(tree_network)) root.after(1000, lambda: auto_resize_columns(tree_ping)) # 运行 GUI root.mainloop() ``` # 截图 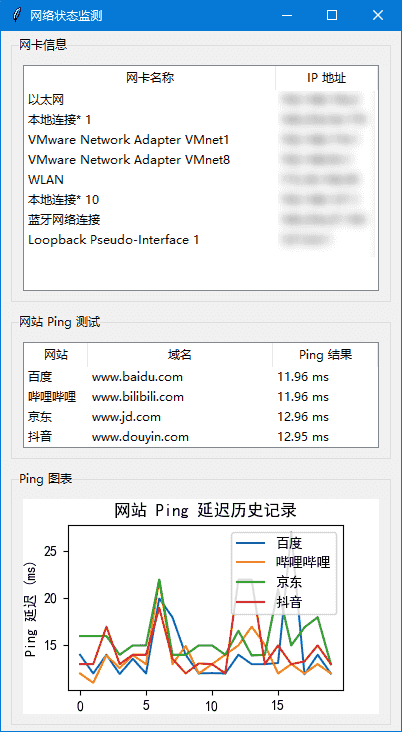 # 结语 需要自取,水一篇文章,emm © 允许规范转载 打赏 赞赏作者 支付宝微信 赞 如果觉得我的文章对你有用,请随意赞赏

1 条评论
为何代码排版有问题?博主大大OωO我是你的好同事